See how your whole company actually uses AI
The Inflect AI tooling overview shows adoption, usage intensity and AI literacy across every AI tool and team, so you know who is using AI, how deeply, and where it isn't catching on.
Book a demo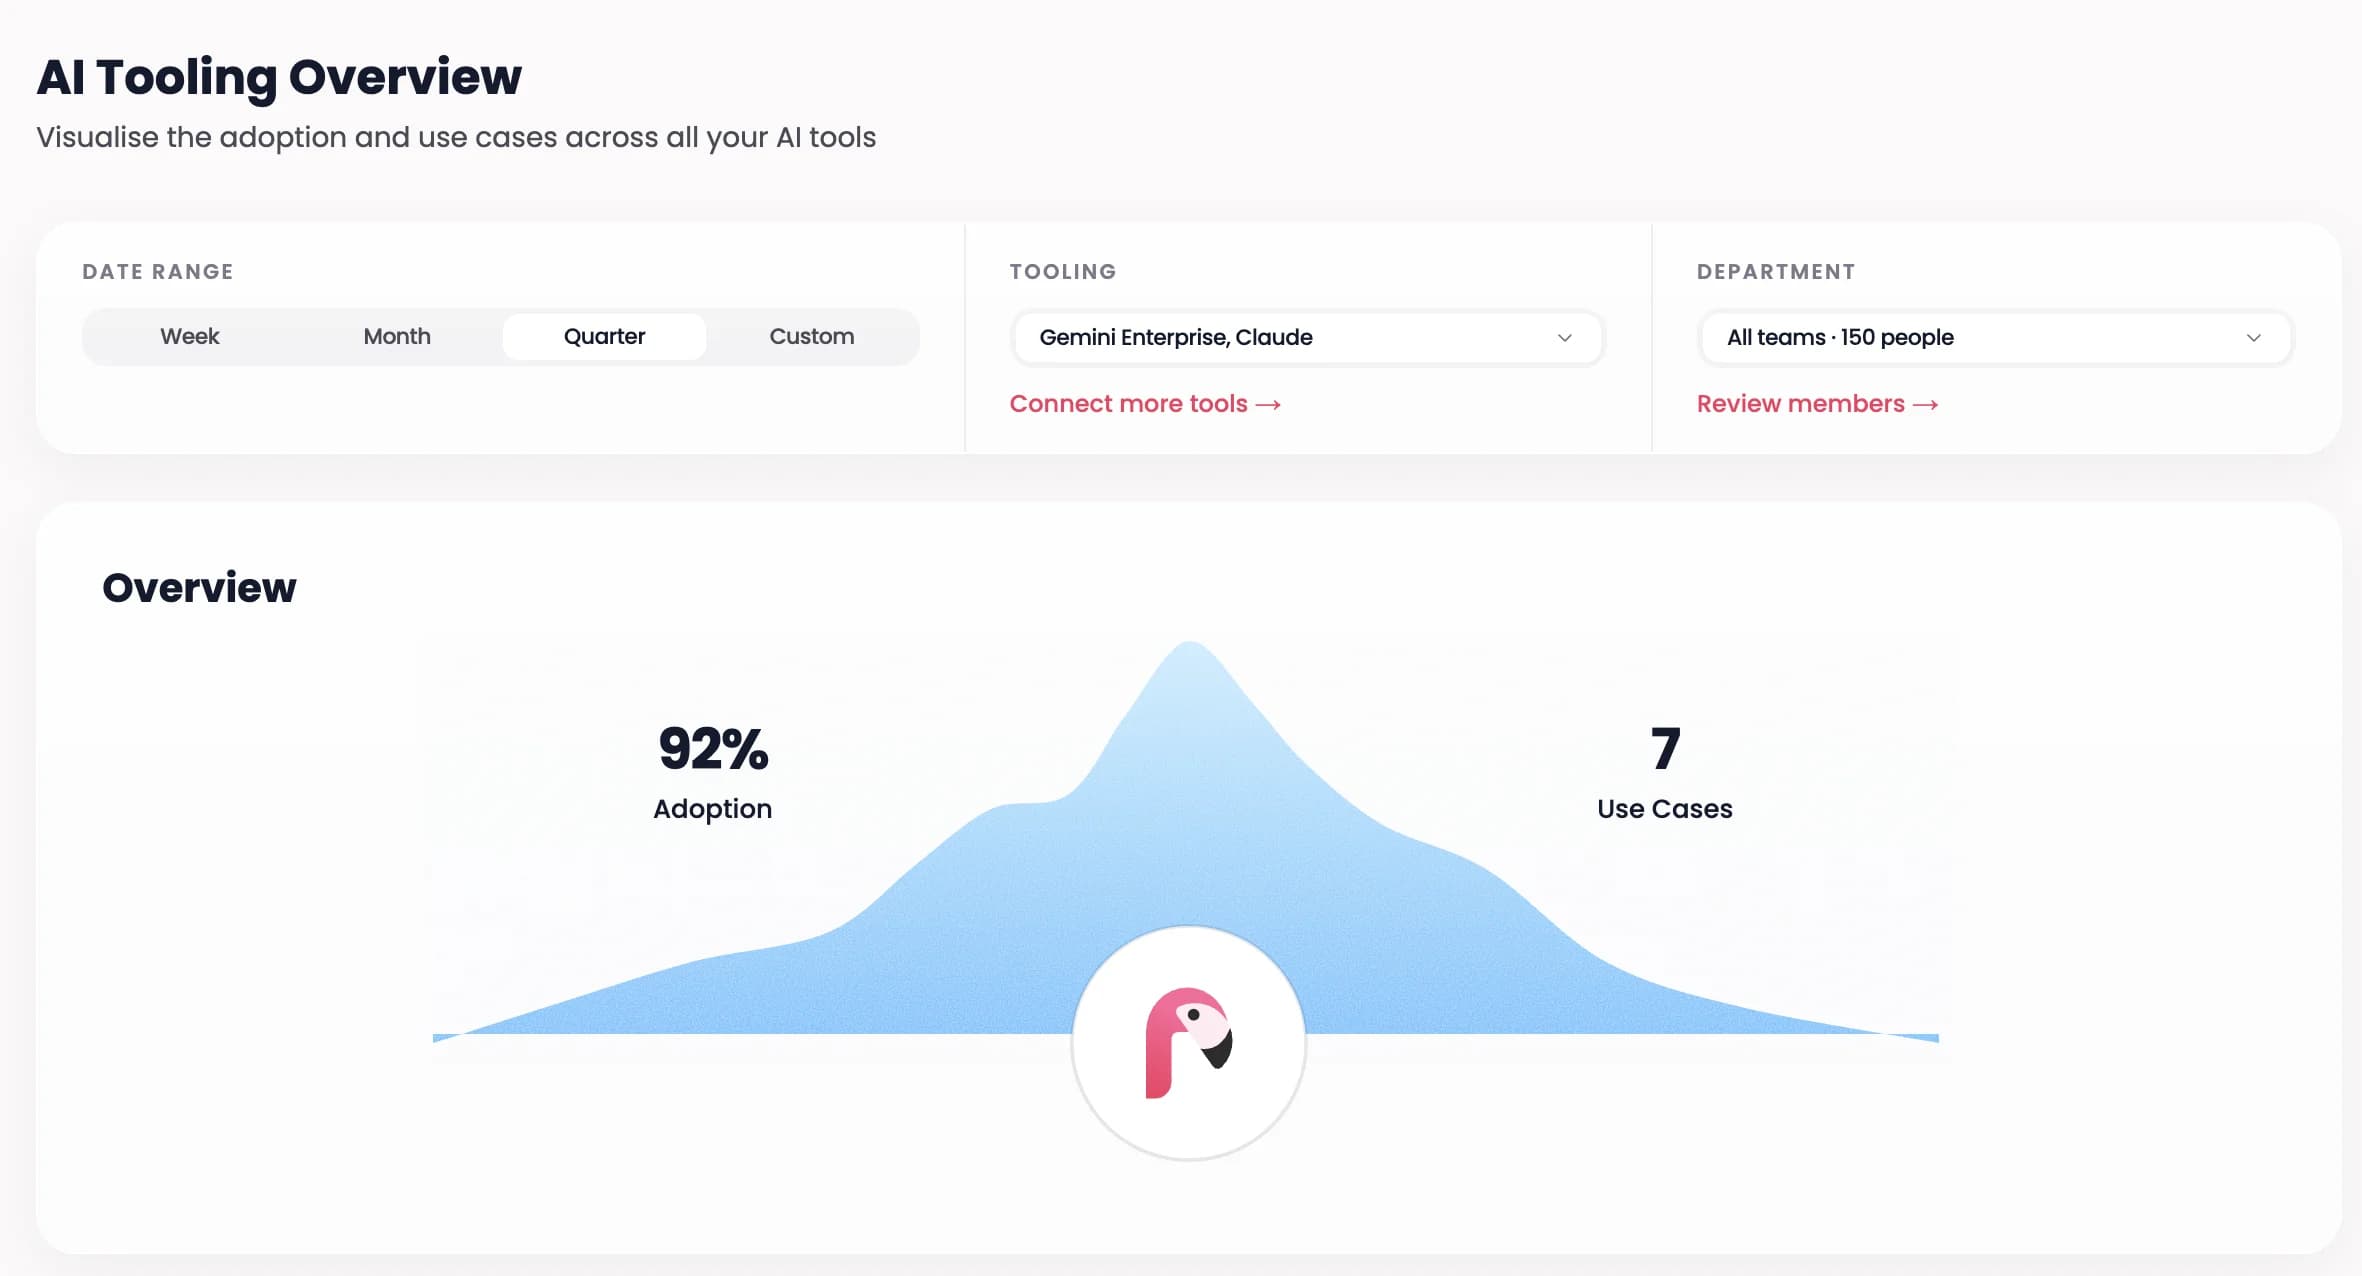
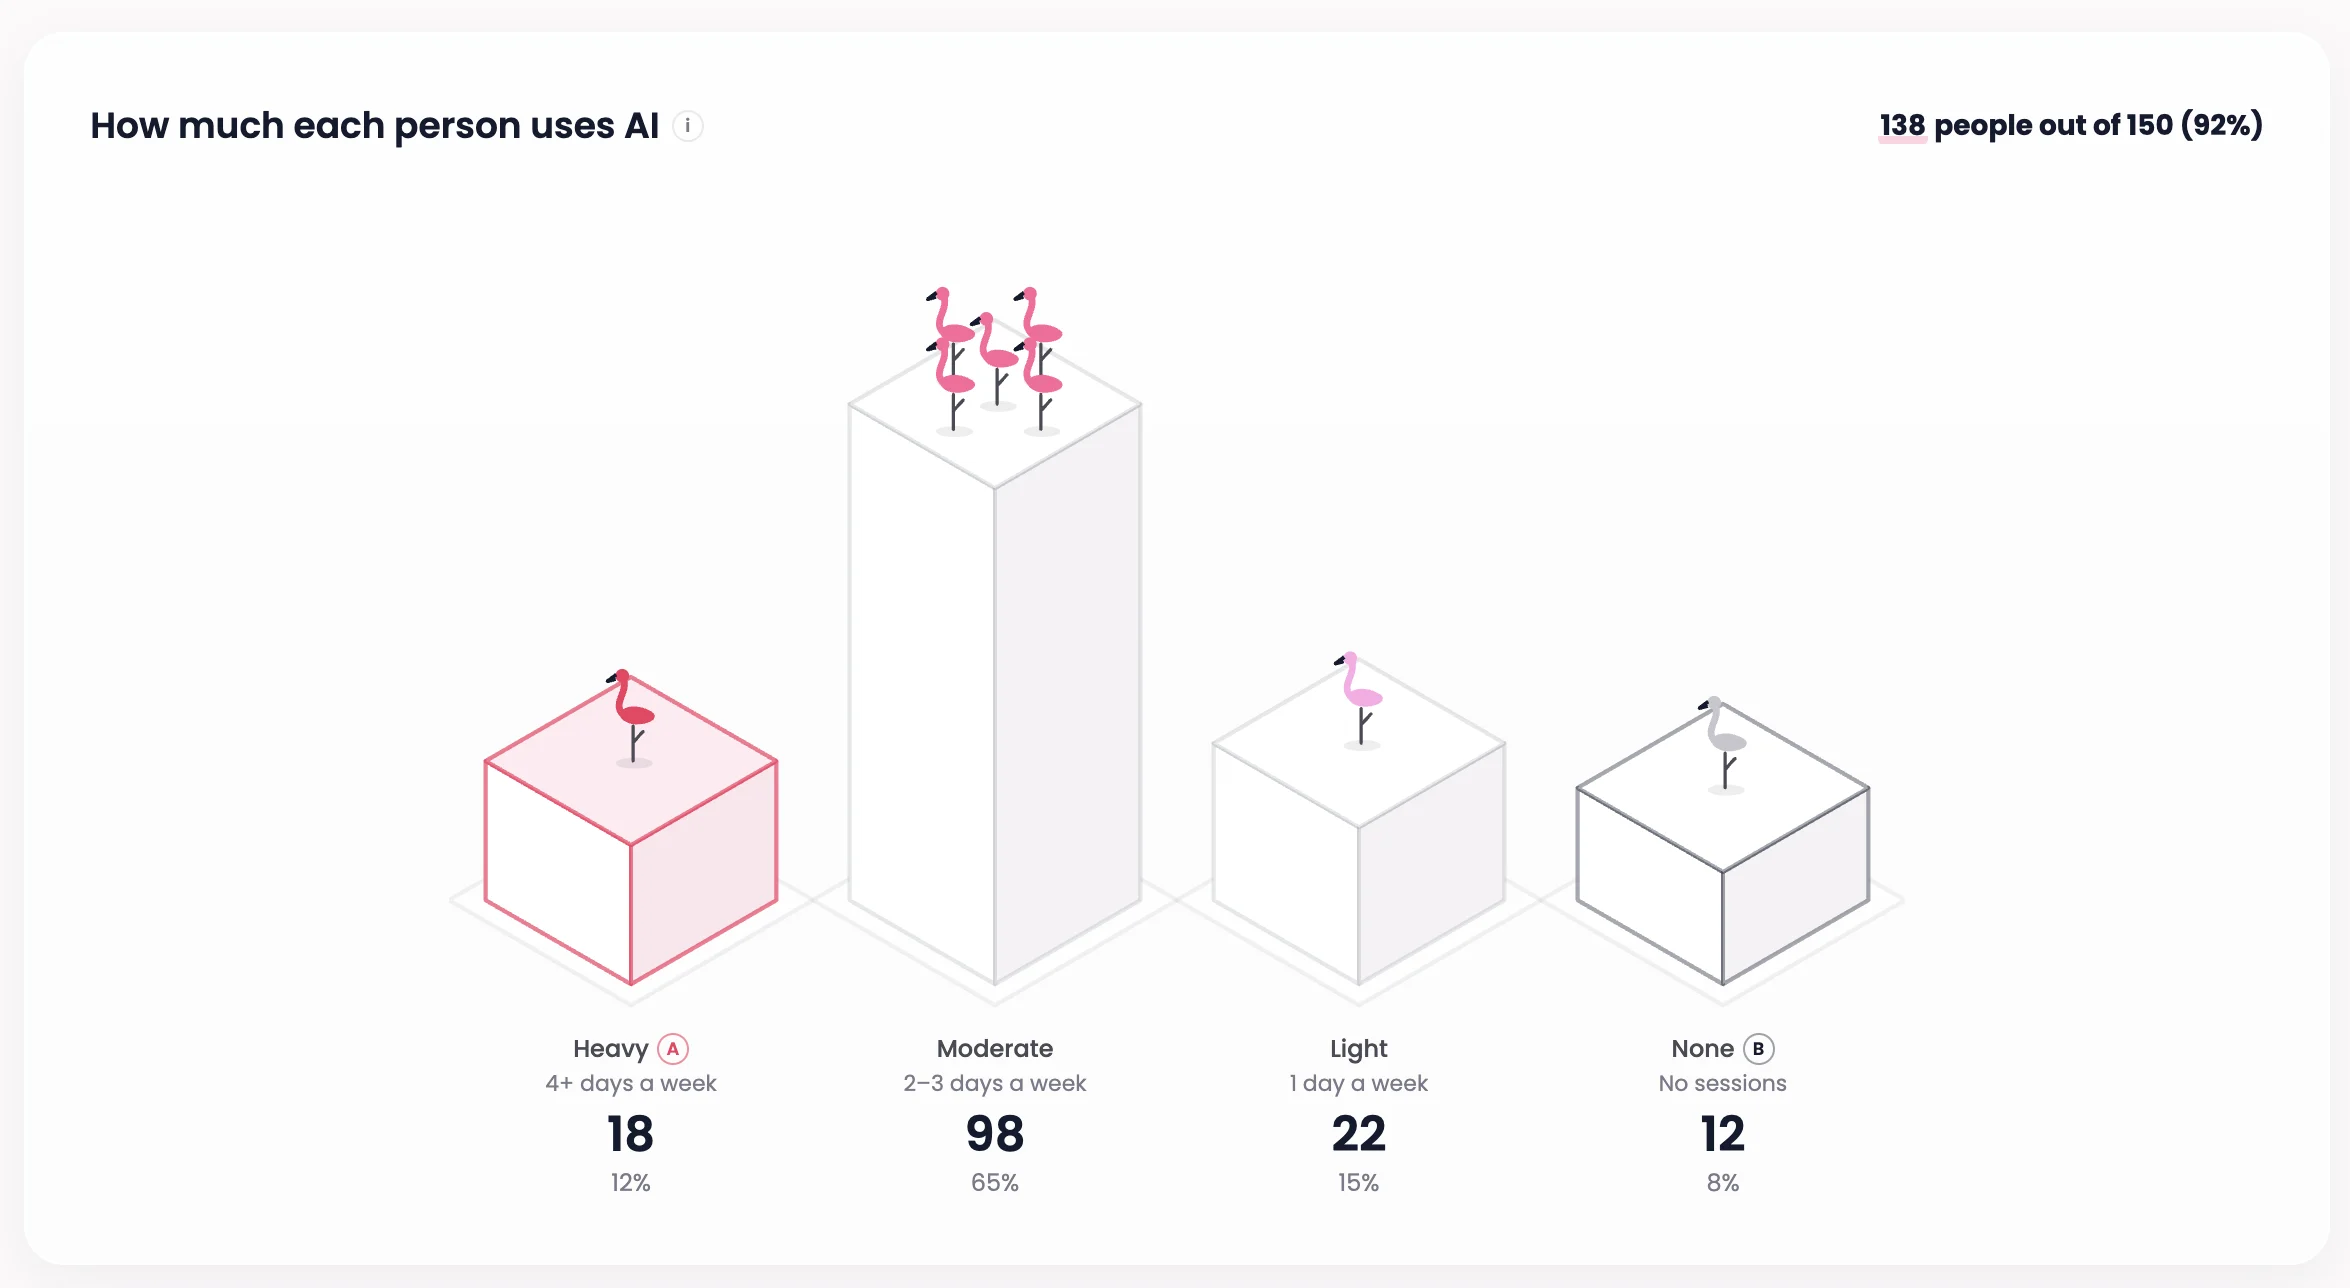
Not just who uses AI, but how much
Adoption alone hides a lot. Inflect splits people into heavy, moderate, light and none, so you can see how deep usage goes before you look at outcomes.
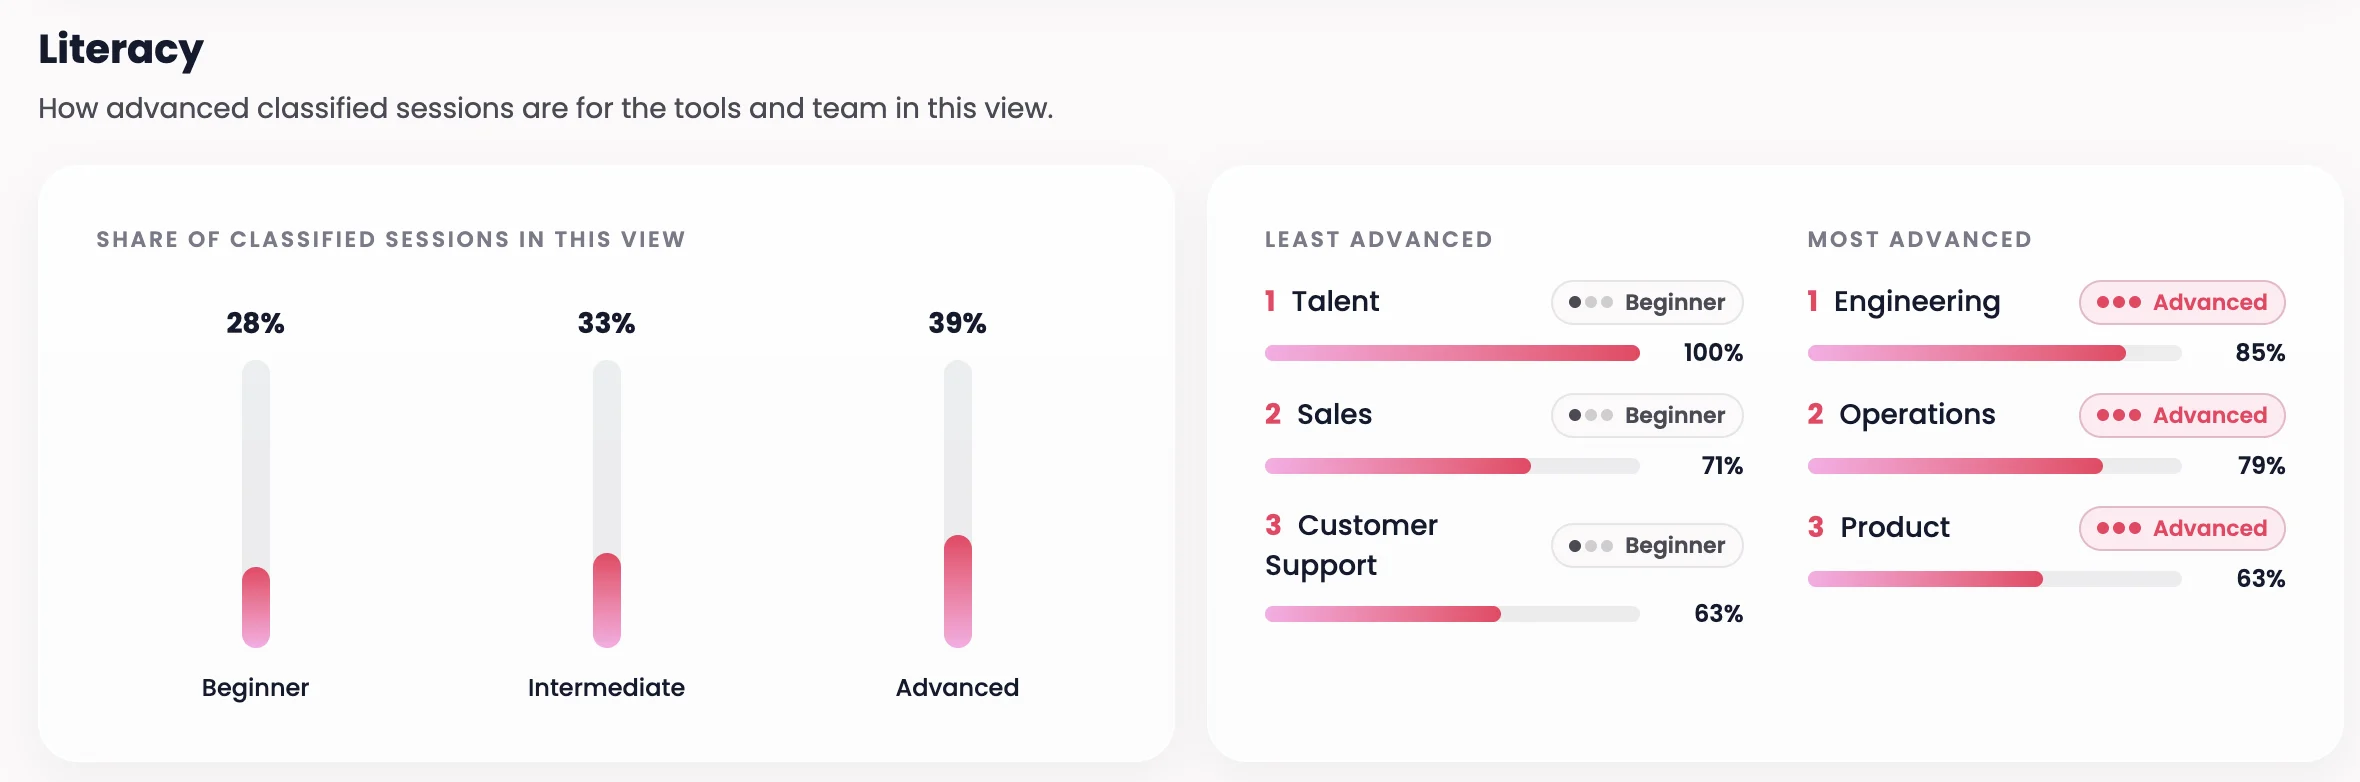
Where skills are strong, and where they aren't
Inflect classifies sessions as beginner, intermediate or advanced, and ranks teams on both ends. You see where to learn from, and where to put training.
Frequently asked questions
What is an AI tooling overview?
An AI tooling overview is a single view of how AI tools are used across a company: how many people use them, how often, for what, and with what level of skill. Inflect builds it from the tools you already have, so there is one answer to "is AI being adopted?" instead of one per tool.
How does Inflect measure AI adoption?
Inflect measures adoption from usage in your connected AI tools. It reports the share of people using AI, then breaks that into heavy, moderate, light and no usage, so you see depth as well as reach.
What does Inflect connect to?
Inflect connects to the AI tools a company already uses. That includes assistants such as Claude, Gemini, OpenAI and Microsoft Copilot, and automation platforms such as Make, n8n and Zapier. Each connected tool feeds the same views, so you compare tools and teams on one footing.